

Right now, enormous wildfires are raging out of control across California. Fanned by warm winds and fed by the dry vegetation of unusually parched landscapes, small blazes that are common in the state during the late summer have escalated into record-setting forces of destruction for the second year in a row.
And despite what the Trump administration’s Secretary of the Interior Ryan Zinke has claimed, yes, climate change is definitely part of the cause.
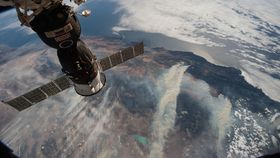
Demonstrating just how far-reaching the effects of the 12-plus fires currently burning have become, NASA has released an animation showing that the toxic carbon monoxide emitted from these flames has now drifted nearly all the way to the east coast, polluting the air over each region in its wake.

The images in the time-lapse document the movement of carbon monoxide between July 29 and August 8, during which time the gaseous combustion byproduct splits into two fronts, one heading south toward Texas and the other bearing northeast.
As the agency notes in a press release, carbon monoxide released from fires rises high into the atmosphere, where it rapidly spreads out due to low pressure, and begins to be transported by the strong wind streams present at high altitudes. These winds may carry pollutants long distances before pushing them back downwards, into the air we breathe.
The data for the animation was collected by the Atmospheric Infrared Sounder (AIRS) on NASA's Aqua satellite, as well as two other instruments – the Measurement of Pollution In The Troposphere (MOPITT) on NASA's Terra satellite, which looks at carbon monoxide in the lower atmosphere, and the Moderate Resolution Imaging Spectrometer (MODIS), which can track carbon monoxide or other substances across large areas of land or sea.
Working together, these tools produce three-dimensional maps of the Earth’s climate, weather patterns, and concentrations of greenhouse gases and aerosolized particulate matter that reach from the edge of the atmosphere down to the surface.
To view a fascinating albeit terrifying gallery of photographic images of the wildfires, also taken by NASA satellites, click here.