Space and Physics
 PUBLISHED





What you’ll discover in this article
- A map of the universe containing almost 4 billion objects, with nearly half of them outside the galaxy, can be viewed online.
- The map took 13 years to create and will give astronomers the tools to answer cosmology’s biggest questions, while also allowing curious amateurs to bathe in the wonder of the images.
- Talking to IFLScience, Dr Arjun Dey said, “DESI is making a precision measurement of the history of expansion of the universe over the last 11-12 billion years.”
The Dark Energy Spectroscopic Instrument (DESI) Legacy Imaging Surveys has released a map that combines 13 years of observations from three of the most powerful telescopes in the world.
Tracking the universe in staggering detail, the map is intended to help astronomers in their quest to reveal the nature of dark matter and dark energy, but it’s online for anyone to use - including you and me.
The mindboggling bigness of space is legendary, but a few statistics from this new map help drive it home.
It contains 5.6 trillion pixels collected through 263,407 telescope exposures, capturing almost four billion objects, from relatively nearby asteroids to unfathomably distant black holes. A preliminary release in 2023 has already been used in more than 1,800 peer-reviewed science papers, despite containing only a fraction of the objects seen in this new map.
More than just a map, though, the survey has measured the spectrum of 21 million stars and 48 million galaxies, which are also available online with their redshifts representing the largest 3D map of the universe.
The survey’s images combine both visible and near-infrared light and cover 75 percent of the sky. Dr Arjun Dey of NOIRLab told IFLScience the missing 25 percent is composed of the plane of our own galaxy.
“The portion of the sky covered in this data release is primarily what astronomers refer to as the extragalactic sky, i.e., the portions of the sky where our view of the extragalactic universe is unobscured by the dust and density of stars in the disk of our own Milky Way Galaxy,” Dey said.
The four billion objects include plenty of stars – Dey estimated they probably account for 95 percent of the 2.2 billion point sources in the map - but they’re not the reason for the survey’s creation.
“Since our team is primarily driven by questions about cosmology, we need to be able to find and study faint, distant galaxies, spanning most of cosmic time,” said Dey. “It is hard to do this by looking through the disk of our own Milky Way where the density of stars is high and where dust and gas are concentrated.”
“So we’re mostly looking out of the disk, in cones centered perpendicular to the disk; the regions ‘missing’ from our maps are the regions covering the plane of the Milky Way.”
Anyone wanting to see what all the fuss is about can visit Legacy Survey Sky Viewer and zoom in and out, jump to the object that takes their fancy, or rotate at will. Best to have plenty of bandwidth if you don’t want to have to wait for it to load, however.
Those of a more studious nature can hunt for precious rare specimens, such as the gravitational lenses that let us see much more distant galaxies than would otherwise be possible, or hunt for transient events like supernovae.
If that’s still not enough detail for you, a searchable database contains the DESI Legacy Survey’s full catalog of data. This, Dey said, is the original driver for the project.
“DESI is trying to understand the mysterious dark energy which we think may be responsible for the late-time acceleration of the universe,” Dey told IFLScience.
“DESI is making a precision measurement of the history of expansion of the universe over the last 11-12 billion years or so, and does this by observing distant galaxies to trace the scale of the universe at a range of epochs and measure how it has changed over time. Hence the focus on galaxies.”
Already changing cosmology
Before its public launch, the latest version of the survey had already shaken cosmology with what has been interpreted as evidence that dark energy’s acceleration of the universe’s expansion may be weakening.
Nevertheless, telescope time is so precious that astronomers would not waste the observations of stars within our own galaxy the map provides.
“The goal for this portion of the DESI survey is to map out the structure of the Milky Way’s halo and to understand its formation history,” Dey explains. To do that, they’re “trying to find [the stars] which are within our halo, and measure their radial velocities, temperatures, distances, etc.”
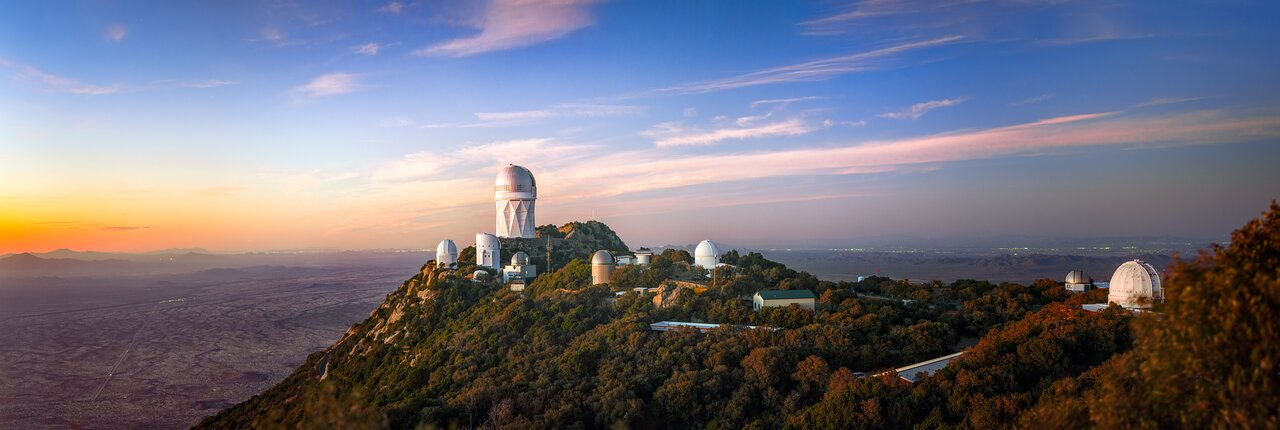
“It’s part of the fabric of astronomy research now,” said Dr David Schlegel of the Lawrence Berkeley National Laboratory, in a statement. “When you're working with astronomical objects today, you often start by pulling up the Legacy Imaging Viewer to see what you’re looking at.”
Although the astonishing power of the Vera C. Rubin Observatory and the recently launched Nancy Grace Roman Space Telescope may one day be used to make maps far more detailed and high-resolution than this one, it will not become irrelevant.
Comparisons between the newer telescopes’ observations and this survey will enhance our understanding of what each instrument produces.