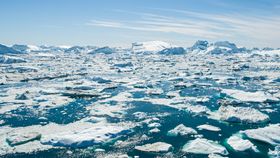
Ice loss in Greenland and Antarctica is a major driver of global sea-level rise but quantifying it exactly has been a challenge. With NASA’s ICESat and ICESat-2, scientists have now used laser altimetry to measure changes to the ice both on the ground and in the ocean around these two landmasses between 2003 and 2019. The picture the data paints is a worrying one.
Over the last 16 years, the ice loss from these two regions has contributed to a 14-millimeter (1.4-centimeter) rise in sea levels. In the southernmost continent, the ice sheet lost an average of 118 gigatons of ice per year, while Greenland ice loss averaged 200 gigatons per year. A single gigaton of ice is enough to fill 400,000 Olympic swimming pools. The findings are reported in Science.
The analysis was possible thanks to the measurements obtained by the Ice, Cloud, and land Elevation Satellites (ICESat). The original ICESat operated between 2003 and 2009 and ICESat-2 was launched in 2018. The team matched tens of millions of sites between the two satellites, providing a view of past loss and possible insight into the future.
"If you watch a glacier or ice sheet for a month, or a year, you're not going to learn much about what the climate is doing to it," lead author Benjamin Smith, a glaciologist at the University of Washington, said in a statement. "We now have a 16-year span between ICESat and ICESat-2 and can be much more confident that the changes we're seeing in the ice have to do with the long-term changes in the climate. And ICESat-2 is a really remarkable tool for making these measurements. We're seeing high-quality measurements that carpet both ice sheets, which let us make a detailed and precise comparison with the ICESat data."

For Greenland, warmer summer temperatures have melted the ice from the surface of ice sheets and glaciers (like in this incredible photo), and warmer ocean temperatures are eroding the ice in coastal areas. ICESat-2 measured that the Kangerdulgssuaq and Jakobshavn glaciers have lost between 4 and 6 meters (14 and 20 feet) of ice per year, for example.
Measurements in Antarctica showed that the interior regions have gained mass due to increased precipitation but it is far outweighed by the loss from the coast, where the warmer ocean is again to blame. Ice shelves float on water so they do not contribute to sea-level rise directly, but they provide stability to the ice sheets behind them. If they melt, the system is in danger.
"It's like an architectural buttress that holds up a cathedral," added co-author Helen Amanda Fricker, a glaciologist at Scripps Institution of Oceanography at the University of California. "The ice shelves hold the ice sheet up. If you take away the ice shelves, or even if you thin them, you're reducing that buttressing force, so the grounded ice can flow faster."
The most affected region in the southern continent is West Antarctica, where certain ice shelves have lost up to 5 meters (16 feet) of ice per year.