

The bottom of the ocean is a mysterious place. We probably know the surface of Mars better than areas in the Atlantic and the Pacific. But we now have our best look at the seafloor yet, thanks to the NASA Earth Observatory.
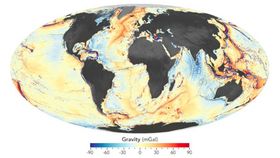
The researchers looked at gravitational anomalies to produce a detailed analysis of underwater features, and by doing this were able to spot anything larger than 5 kilometers (3 miles).
The paper was published in Science last year, and the data was used to create small maps that are even available on Google Earth. The map gives the first comprehensive look at the entire data set showing the diversity and complexity of the depths of Earth’s oceans.
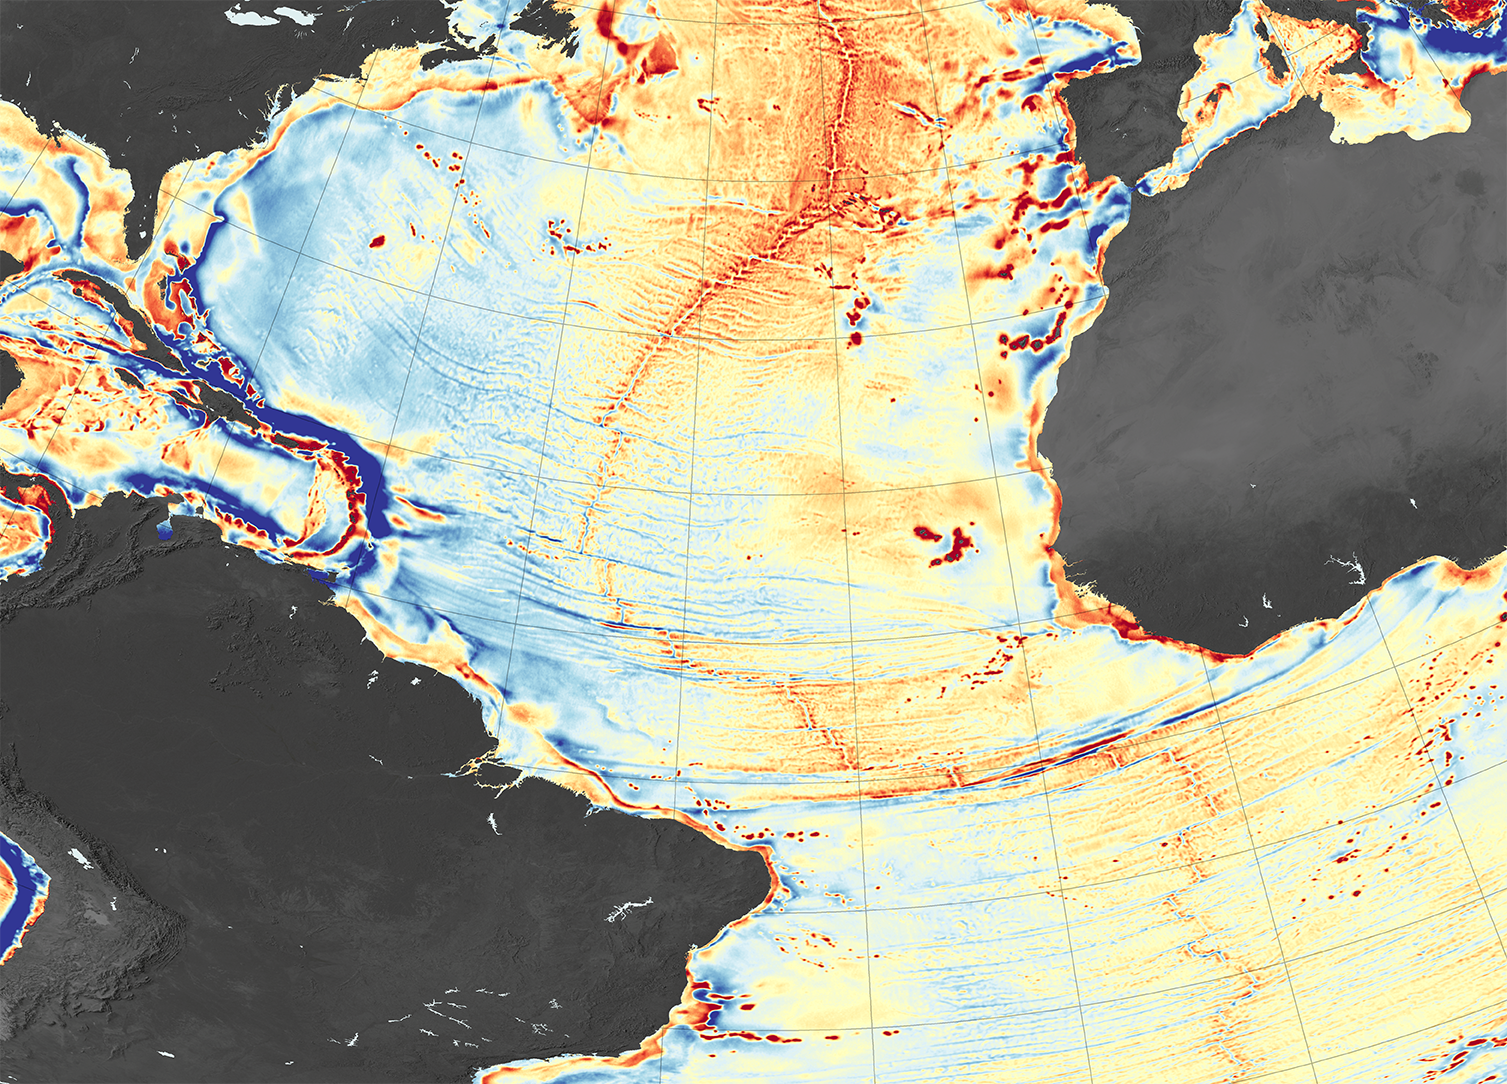
This section of the map shows part of the Atlantic Ocean. Red areas are mountains and ridges, blue areas are canyons and trenches. NASA Earth Observatory/Joshua Stevens
Traditionally, ocean floor maps are made using sonar. However, ships are small compared to the big blue sea, and this kind of technique is only good for limited portions of the seabed. It is expensive and time consuming, and it is believed this is why only about 5 percent of the ocean floors have been explored.
Instead, the team behind the new research used satellites to precisely measure the gravitational field of our planet. An underwater mountain would have a slightly stronger pull (appearing red in the map), and a submarine canyon would have a weaker gravitational field (blue in the map).
This technique has already been employed to look at another “invisible” area of the planet; by measuring gravity, researchers were able to observe the geological formations present in Antarctica beneath the thick sheet of ice.
The measurements were taken by the NASA-CNES Jason-1 satellite as well as using ESA’s CryoSat-2 and data from missions in the 1980s and '90s. The data was combined through computer analysis and the map released by the NASA Earth Observatory is the most extensive map of the ocean floor ever made.
This map will further improve our understanding of plate tectonics and evolution of the ocean, as well as giving targets for more precise sonar investigations.