

A newly published online platform created by the European Space Agency allows public users to track pollution around the world, including changes in air quality observed during the global coronavirus lockdown and shelter-in-place measures.
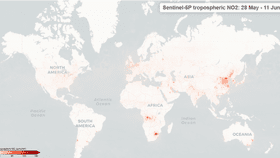
The maps pull data from the European Space Agency's (ESA) Copernicus Sentinel-5P satellite, which was launched in 2017 to map global pollutants with the use of a Tropomi instrument that detects the “unique fingerprint” of atmospheric gases to image air pollutants accurately and at a higher resolution. On a global scale, the interactive maps show the average nitrogen dioxide concentration over a 14-day average, highlighting the “drastic reductions” of concentrations over many areas.
Nitrogen Dioxide (NO2) is a “nasty smelling gas” emitted from vehicles and power plants when burning fuel. Breathing air with high concentrations can irritate the human respiratory system and lead to asthma, coughing, wheezing, as well as difficulty breathing, according to the US Environmental Protection Agency. When NO2 interacts with water, oxygen, and other chemicals, it can form acid rain capable of harming vulnerable ecosystems. Global concentrations can vary widely between days due to fluctuations in emission rates or changing weather conditions, which requires researchers to analyze levels over a longer period of time.
Satellite images from March showed a sustained decrease in NO2 levels over China since the beginning of the year, partly due to the economic slowdown from the coronavirus outbreak in what Stanford researchers said could have saved the lives of as many as 77,000 people. Now, the region is seeing an increase in NO2 levels as pockets of the world are beginning to lift shelter-in-place and lockdown measures.
“Now that Covid-19 mitigation measures are being relaxed in many countries the NO2 concentration is also increasing. Over China, the relaxation of Covid-19 measures brought the NO2 concentrations back to normal levels, as shown in the figure below,” writes ESA.

Across Europe, “strong reductions” in NO2 concentrations were observed between March and April of this year over several major cities, among them Paris, Madrid, and Rome.

India saw pollution levels drop in some cities by as much as 50 percent in what experts from the European Union Copernicus program credit to coronavirus-related lockdown measures.

ESA concludes that monitoring air quality in Europe and around the world is important in the context of changing air quality, particularly as it relates to global shutdowns related to Covid-19.