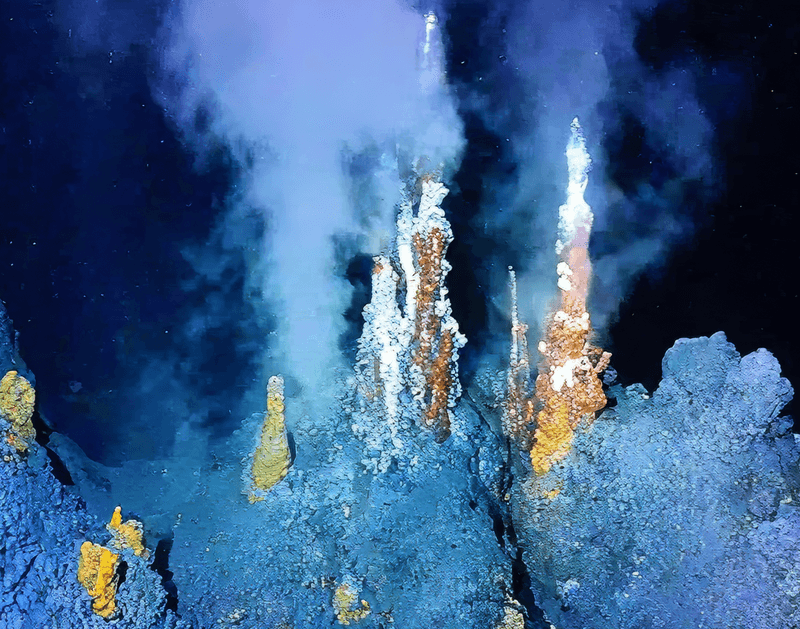
You might think the sea is a tranquil void beneath the waves, other than the odd lurking shoal of fish. But that's far from the case. The water around Antarctica, for example, has some of the most powerful currents in the world, which have a profound influence on oceans, seas and coastlines across our planet.
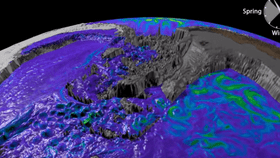
The animation below is a visualization of one of the most mindbogglingly detailed data sets on the circulation of water in the Southern Ocean.
Such a vast amount of data was used to create this that it took seven hours to process just one second of animation. However, it was hardly made on a Windows 95 laptop with dial-up. It was created with data generated on Australia’s most powerful supercomputer – Raijin, named after the Shinto god of thunder, lightning and storms.
These oceans are made up of layers of water with different densities, based on their salt content, which means the densest, saltier water sinks to the bottom. Water rejects the salt when it freezes, leaving the surrounding water more salty and therefore more dense and “heavy.” As surface temperatures rise, less ice is formed, disrupting the subtle balance of all these layers. Therefore, warming waters might be able to explain the reducing size of the area’s densest and most important layer – the Antarctic bottom water.
Dr Andy Hogg, from the ANU hub of ARC Centre of Excellence for Climate System Science, led the project and hopes it could lead to some more concrete answers. In a statement, he said: “Scientists who have seen the visualization have been astonished at the level of detail."
“It helps us understand what is happening in locations that are difficult to observe and may explain why Antarctic bottom water is disappearing, becoming less saline and warmer. It may give us important insights into a future under climate change.”