

Jupiter is the largest planet in the Solar System and it hosts the largest known storm, a cyclone larger than Earth known as the Great Red Spot. This feature is just one of the incredible weather patterns on the gas giant planet. International collaborations have been looking at what’s going on under those wispy clouds, and now we have the best views yet.
Astronomers combined observations of Jupiter over the last three years from two of the sharpest telescopes we have, the Hubble Space Telescope and the ground-based Gemini Observatory in Hawaii, with those collected by NASA’s Juno Spacecraft to provide these incredible pictures. The results are published in The Astrophysical Journal Supplement Series.
Thanks to Juno, scientists are capable of tracking the powerful thunderstorms that occur on the gas giant, and produce radio maps of the planet's lightning, which is three times as powerful as the strongest lightning we experience on Earth. Those maps were then combined with visible observations from Hubble and infrared views from Gemini.
“Scientists track lightning because it is a marker of convection, the turbulent mixing process that transports Jupiter’s internal heat up to the visible cloud tops,” lead author Dr Michael Wong, from the University of California, Berkeley, said in a statement.
The combined data suggest deep water-rich clouds, rising convective towers of moist air (16 times as tall as the tallest earthly thunderheads), and clear regions around them, caused in their view by the downwelling of drier air from the convective towers.
"Because we now routinely have these high-resolution views from a couple of different observatories and wavelengths, we are learning so much more about Jupiter's weather," co-author Dr Amy Simon, from NASA's Goddard Space Flight Center, said in a statement. "This is our equivalent of a weather satellite. We can finally start looking at weather cycles."
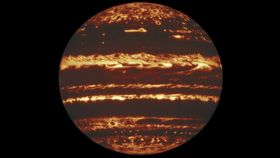
The infrared data (top image) is probably the most striking, showing where the heat from Jupiter’s interior can escape freely without being blocked by higher clouds. While Jupiter’s atmosphere might seem like a swirly but uniform mess, this shows that there are holes in the cloud cover.
"It's kind of like a jack-o-lantern," said Wong. "You see bright infrared light coming from cloud-free areas, but where there are clouds, it's really dark in the infrared."
This work has really given us a picture of the movements in three dimensions of Jupiter’s atmosphere. Given its importance, the team has decided that all the data from this trio of instruments is made available for other researchers to access and study themselves.
"What's important is that we've managed to collect this huge dataset that supports the Juno mission. There are so many applications of the data set that we may not even anticipate. So, we're going to enable other people to do science without that barrier of having to figure out on their own how to process the data," Wong explained.