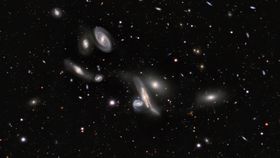


Astronomers have released an incredible new map of the Universe. This two-dimensional image is the culmination of six years worth of work for the Dark Energy Spectroscopic Instrument (DESI) Legacy Imaging Surveys. This map is the largest ever in terms of sky coverage, sensitivity, and total number of galaxies.
The rest of this article is behind a paywall. Please sign in or subscribe to access the full content.The stunning map can be explored in its entirety on this website. It contains 10 trillion pixels – or about 833,000 high-resolution smartphone photos. It was created over the course of 1,405 observing nights at three observatories with years of data from Kitt Peak National Observatory, Cerro Tololo Inter-American Observatory, and NASA’s Wide-field Infrared Survey Explorer (WISE), thanks to the work of 150 observers and 50 other researchers. The final result contains 1 petabyte of data, which is roughly one million gigabytes.
This phenomenal survey is the most uniform and deep survey that has ever been conducted, and it is not the end, but the beginning. Researchers will target 35 million galaxies and 2.4 million quasars on the map and measure their precise distances, with some expected to be 12 billion light-years away. Over the next five years, the DESI survey will create a giant three-dimensional map of the universe, providing a much clearer picture of the distribution of galaxies in the cosmos and the rate at which the universe is expanding.
The survey was in fact designed to understand dark energy, the mysterious (and currently hypothetical) substance that is believed to be causing the accelerated expansion of the Universe. There are some major uncertainties when it comes to the true nature of dark matter and different methods employed to measure the expansion rate of the universe, deliver different results suggesting that our model of cosmology might not be correct.
To get all this information from the galaxies, researchers need to obtain their spectra. They need to get their light and break it apart into a rainbow, from which astronomers can work out their position and how quickly they are moving away from us. To obtain the spectra, a thin fiber-optic cable is pointed at each individual galaxy.
Thanks to automated robots, the position of these fiber-optics cables is adapted to each area of the sky the telescopes are looking, producing spectra for 5,000 galaxies at a time.
“To solve some of the biggest mysteries in fundamental physics today, we are driven to create huge digital databases of stars and galaxies, which in turn enable a new data-mining approach to making additional astronomical discoveries,” Adam Bolton, Director of NOIRLab’s Community Science and Data Center, said in a statement.
Several exciting pieces of research have come out from this map already, with many more on the way.