

There isn’t much in the way of satellite imagery of the Arctic from 250 years ago, as you can imagine. So, to get a better picture of the history of the Arctic’s sea ice, researchers are looking to the next best thing – Captain Cook’s maps.
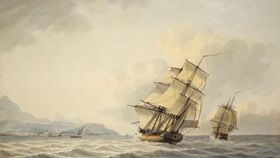
Harry Stern, a mathematician from the University of Washington’s Polar Science Center, has authored a new study recently published in the journal Polar Geography. He managed to get his hands on the polar maps and records from HMS Resolution and HMS Discovery in the years leading up to 1778. Led by Captain James Cook, the eminent explorer of his day, these missions explored the stretch of water between Alaska and Siberia, which includes the Bering Strait, in an attempt to find the Northwest Passage around the American continent.
The documents that Cook and his crew made of the Chukchi Sea are now being used to peer deeper into the history and geography of the sea ice edge north of the Bering Strait.
Along with detailed accounts of hundreds of walruses roaring through the foggy nights, Captain Cook’s journal entries show that they went to great lengths to trace the ice edge during their Arctic voyages, in their attempts to find passage. The study notes that the maps are surprisingly well-crafted, apparently accurate, and also “provide the earliest historical record of the summer sea-ice edge in the Chukchi Sea.”
Most crucially, the maps show that the change in sea ice we’ve witnessed since the 1990s is even sharper than previously assumed.
From the 1990s onwards, the sea ice edge has been receding further and further north. This new trend broke a pattern of regular and predictable variability that dates back to when records began around the mid 19th century.
However, Cook’s maps of the Chukchi Sea in 1778-1779 show that this now-broken pattern extends back to almost a century before the official records began. This helps to counter the idea that the 1850-era records could simply be an odd blip of variation in the sea ice, and therefore comparisons with modern-day records are misleading.
On a side note, these records also show how pioneering the voyages of Captain Cook truly were. Even considering the lack of technology and engineering know-how around in the 1770s, the records show that the Arctic seas would have been notably harder to navigate than they are now, like sailing around a minefield of precarious and ever-shifting ice edges.
In fact, clear sailing through the Arctic is likely to only get easier. By the end of the century, it’s expected that tankers will be able to sail through the Arctic Ocean all year round due to the decline in sea ice. Considering how hard he worked to find a route through, we're not sure how impressed Cook would be to know that last year the first cruise ship passed through the Northwest Passage taking tourists on an unprecedented leisure cruise with comparative ease.