


More than 133.9 million Americans live in counties with unhealthy levels of air pollution, according to the American Lung Association's 2018 "State of the Air" report. That figure is a 9 million person increase from last year's report.
The rest of this article is behind a paywall. Please sign in or subscribe to access the full content.Pollution leads to various kinds of nasty health outcomes, including asthma, lung cancer, and shortened lifespans.
The new report rounds up air quality data from 2014 to 2016 in the United States. (Because air quality data is plentiful and complicated, the annual ALA reports look two years into the past.)
The report focuses on two key kinds of pollution: particles and ozone.
Particles include everything from dust kicked up during a drought to tiny particles floating in the air from forest fires or fossil fuels. Ozone, or smog, develops in the upper atmosphere when emissions from tailpipes and smokestacks cook in the sun's heat.
Local pollution levels can be measured according to amounts of ozone in the atmosphere, number of days with extremely high particle pollution levels, or levels of year-round particle pollution. Each of those metrics yields different results. Los Angeles is the worst US city for ozone, for example, but not when it comes to year-round particle pollution, which is the ranking we use in this article.
Janice Nolen, the lead author of the ALA report, told Business Insider last year that local problems like car traffic can make cities' ozone or particle problems worse, but that the overall issue is a national one. Even a place with strong environmental rules can be vulnerable to bad air flowing in from other parts of the country.
Here are the US metros with the worst year-round particle pollution. (The report notes that data is missing on all of Illinois and Mississippi, as well as two large counties in California.)
24 (tied). Little Rock-North Little Rock, Arkansas

24 (tied). Las Vegas-Henderson, Nevada-Arizona

22 (tied). Atlanta-Athens-Clarke County-Sandy Springs, Georgia

22 (tied). Knoxville-Morristown-Sevierville, Tennessee

21. Louisville-Elizabethtown-Madison, Kentucky-Indiana

18 (tied). Cincinnati-Wilmington-Maysville, Ohio-Kentucky-Indiana

18 (tied). Johnstown-Somerset, Pennsylvania

18 (tied). San Luis Obispo-Paso Robles-Arroyo Grande, California

15 (tied). Birmingham-Hoover-Talladega, Alabama

15 (tied). Harrisburg-York-Lebanon, Pennsylvania

15 (tied). Houston-The Woodlands, Texas

14. Detroit-Warren-Ann Arbor, Michigan

13. Indianapolis-Camel-Muncie, Indiana

12. Philadelphia-Reading-Canton, Pennsylvania-New Jersey-Delaware-Maryland

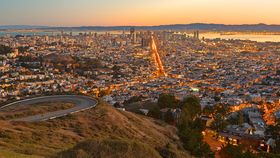
10 (tied). San Francisco-San Jose-Oakland, California

10 (tied). Cleveland-Akron-Canton, Ohio

8 (tied). Lancaster, Pennsylvania

8 (tied). Pittsburgh-New Castle-Weirton, Pennsylvania-Ohio-West Virginia

7. El Centro, California

6. Modesto-Merced, California

5. Fresno-Madera, California

4. Los Angeles-Long Beach, California

3. Bakersfield, California

2. Visalia-Porterville-Hanford, California
-

Wikimedia 1. Fairbanks, Alaska
-

FairbanksMike/Flickr For more information and suggested policy solutions, you can read the full report.
-
Read the original article on Business Insider. Follow us on Facebook and Twitter. Copyright 2018.
Read next on Business Insider: Vintage photos taken by the EPA reveal what America looked like before pollution was regulated


